Google began rolling out Gemini 4 Neon on November 18, 2026, to paying users of its Gemini app and developer tools. The new model can work through spreadsheets, charts and code, with room for a million tokens of context.
An independent test by Vals AI gives an early indication of what that means for customers. Neon finished just behind the top model on a mix of professional tasks. The larger gap was in the bill. Vals recorded $7.40 per test for Neon and $17.94 for the leader, Claude Fable 5.2.
Where Gemini 4 Neon fits
Google DeepMind adapted Neon from Gemini 4 Carbon, its model for long, demanding projects. Google positions Gemini 4 Hydrogen for quick everyday tasks. Neon targets work that needs several steps and comes up often enough for the cost of each run to matter.
Google gives two examples of the work Neon can do. A customer can ask it to trace a jump in utility charges. Someone seeking a refund can ask it to cross-check receipts and other records. Its context window sets the amount of material it can consider at once. A token is a unit the model uses to represent part of that material, such as a piece of a word.
Google AI Pro and Ultra subscribers can choose Neon from the model menu in the Gemini app. Google also offers it in Antigravity, its coding environment, on those plans. Developers can use the paid Gemini application programming interface (API), while business customers can select Neon in Gemini for business or call it through the API.
What a Gemini 4 Neon request costs
Google lists three rates for developers. The price depends on which direction the tokens travel and whether Google can reuse input it already holds in a cache. The table gives each rate in US dollars for the same volume.
| Token type | USD per million tokens | What the charge covers |
|---|---|---|
| New input | $3.00 | Material sent to the model |
| Cached input | $0.15 | Input the model can reuse from its cache |
| Output | $15.00 | Tokens the model generates |
Source: Google
Data as of: 2026-11-18
Generating a million tokens costs five times as much as reading a million new input tokens.
For example, reading 100,000 new input tokens at the launch rate costs 30 cents. Generating 20,000 output tokens also costs 30 cents. In that example the two charges add up to 60 cents, even though the model generates only a fifth as many tokens as it reads.
How Neon scored on professional tasks
Vals AI combines finance, coding, legal and tax tasks in its index. Each sector gets a weight based on its share of US gross domestic product. The score therefore reflects a particular mix of work. A team that mainly builds spreadsheets may care more about the spreadsheet results than the overall ranking.
On November 18, Claude Fable 5.2 led the index at 71.31%. Neon followed at 70.87%, just 0.02 percentage points ahead of Claude Sonnet 5.5. Carbon scored 70.45%. The chart compares the cost per test for those four models on the same index.
Cost per test for the four highest Vals Index scores
Source: Vals AI
Data as of: 2026-11-18
Neon had the lowest cost among the four highest-scoring models.
| Model | US dollars per test |
|---|---|
| Claude Fable 5.2 | 17.94 |
| Gemini 4 Neon | 7.4 |
| Claude Sonnet 5.5 | 16.18 |
| Gemini 4 Carbon | 10.51 |
The time per test also varied across the four Gemini 4 models in the chart. Vals measured 31 minutes and 25 seconds per test for Neon, against 47 minutes and 45 seconds for Carbon. Those figures describe a full benchmark task, which can involve many steps. They tell a developer little about how long a single chat reply will take.
Time per Vals Index test for four Gemini models
Source: Vals AI
Data as of: 2026-11-18
Neon finished 40 seconds ahead of Hydrogen and 16 minutes 20 seconds ahead of Carbon per test.
| Model | Seconds per test |
|---|---|
| Gemini 4 Neon | 1,885 |
| Gemini 4 Hydrogen | 1,925 |
| Gemini 4 Argon | 2,698 |
| Gemini 4 Carbon | 2,865 |
What extra reasoning buys on the Artificial Analysis index
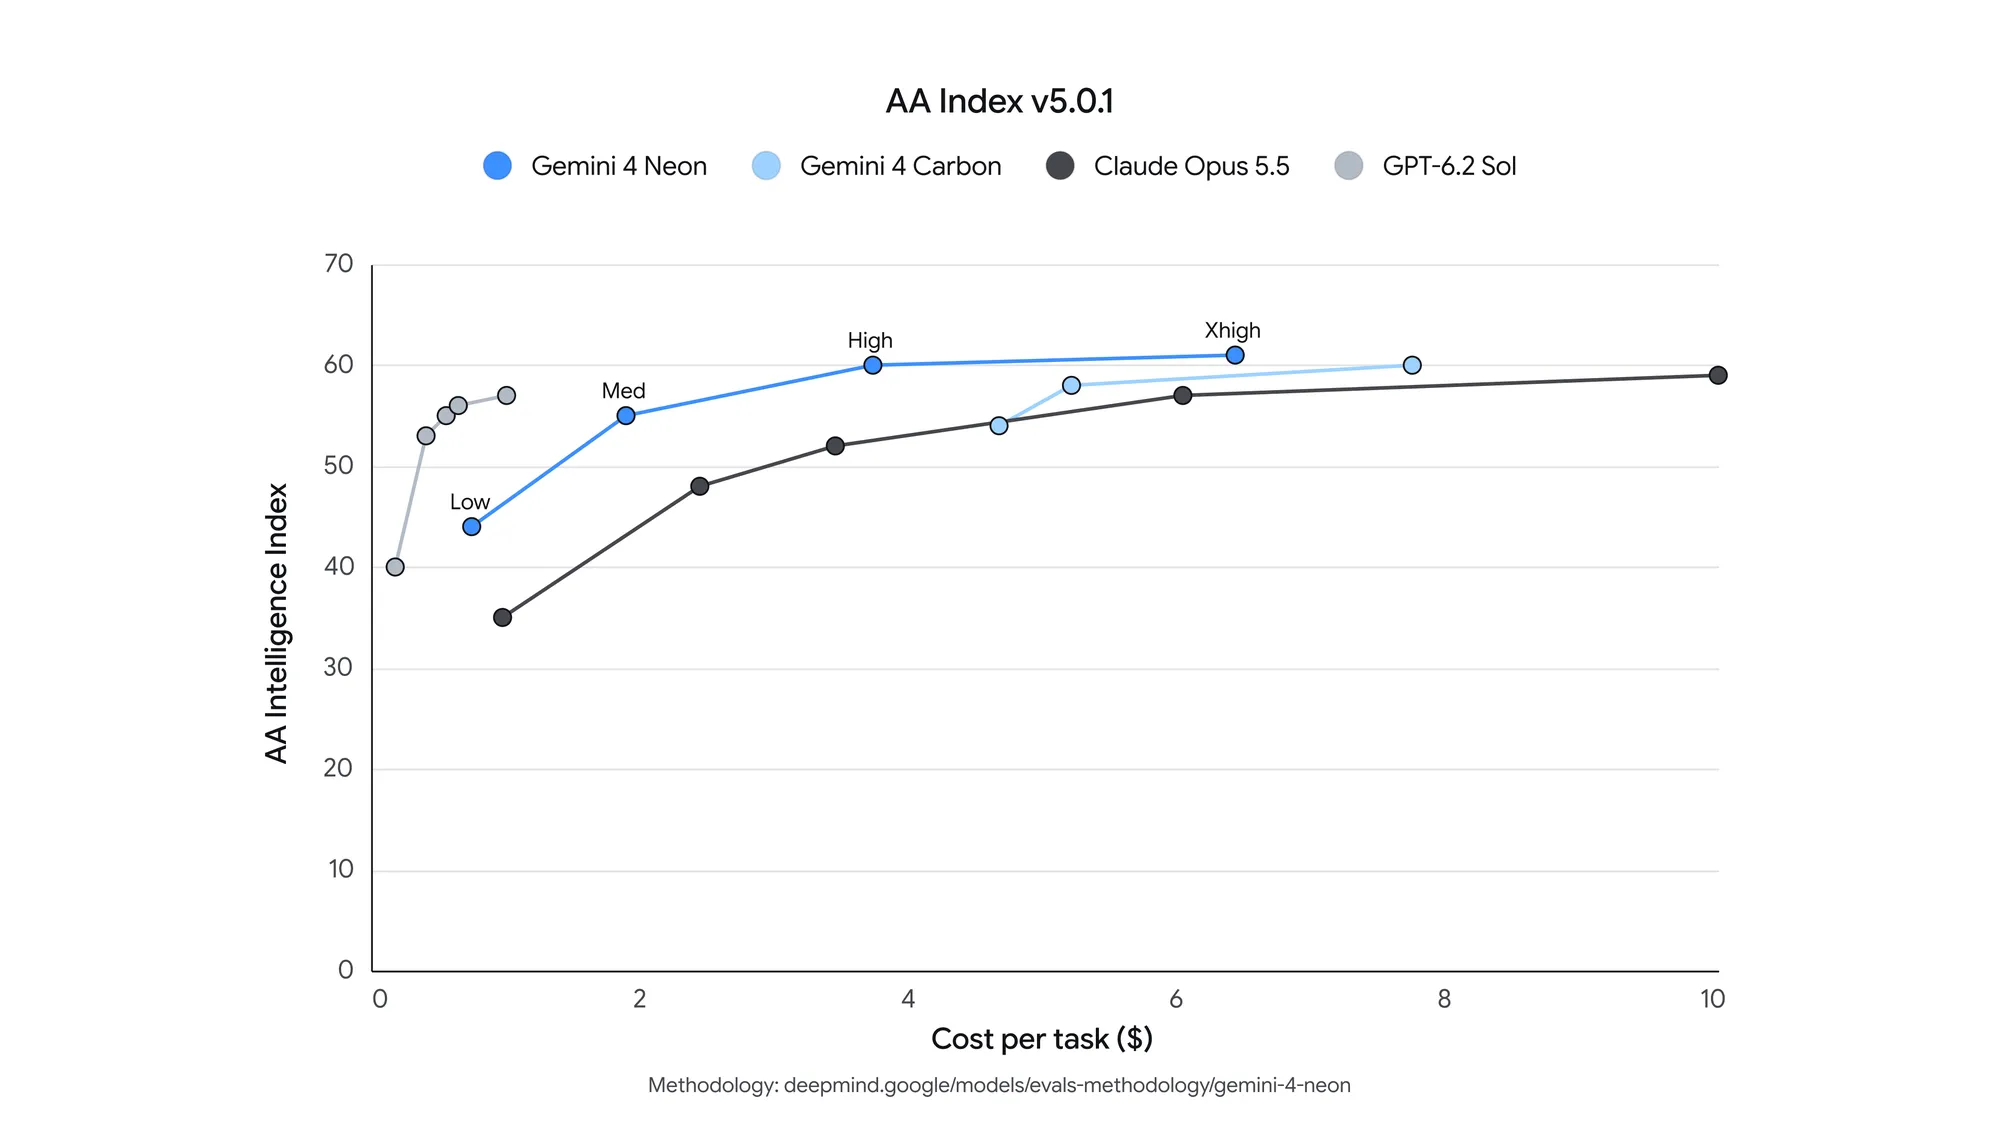
Changing one setting can change both the bill and the answer. Artificial Analysis tested Neon at four levels of reasoning effort. At low effort it scored 44 points on the Intelligence Index. Medium took it to 55, high to 60 and extra high to 61. The chart traces those four settings alongside the results Google plotted for Carbon, Opus and Sol.
How much each model spent for its Intelligence Index score
Source: Google chart using Artificial Analysis results
Data as of: 2026-11-18
Approximate coordinates read from Google’s launch chart. Each marker is one observation. Lines join settings for the same model.
| Approximate cost per task (USD) | Intelligence Index (points) | Model series | Neon effort |
|---|---|---|---|
| 0.7 | 44 | Gemini 4 Neon | Low |
| 1.9 | 55 | Gemini 4 Neon | Medium |
| 3.7 | 60 | Gemini 4 Neon | High |
| 6.4 | 61 | Gemini 4 Neon | Xhigh |
| 4.7 | 54 | Gemini 4 Carbon | |
| 5.2 | 58 | Gemini 4 Carbon | |
| 7.7 | 60 | Gemini 4 Carbon | |
| 1 | 35 | Claude Opus 5.5 | |
| 2.4 | 48 | Claude Opus 5.5 | |
| 3.4 | 52 | Claude Opus 5.5 | |
| 6 | 57 | Claude Opus 5.5 | |
| 10 | 59 | Claude Opus 5.5 | |
| 0.2 | 40 | GPT-6.2 Sol | |
| 0.4 | 53 | GPT-6.2 Sol | |
| 0.55 | 55 | GPT-6.2 Sol | |
| 0.64 | 56 | GPT-6.2 Sol | |
| 1 | 57 | GPT-6.2 Sol |
The price of the last index point
Read the chart from left to right for cost and from bottom to top for score. At high effort Neon reached 60 points for about $3.70 per task. At extra high effort the total rose to about $6.40 per task. The gain from 60 to 61 points cost about $2.70 extra per task. The lines connect tested settings. Points between the markers are estimates, and Google did not label the effort levels on the other three curves.
The time difference was substantial. Artificial Analysis measured 14.8 minutes per task at high effort and 21.5 minutes at extra high. Even within the same index, more effort could hurt on one component. On GDP.pdf, a visual reasoning test, Neon scored 33.4% at high effort and 28.0% at extra high.
The price basis matters when comparing Neon with Carbon. Artificial Analysis calculated $6.44 per task for Neon at extra high effort and $7.76 for Carbon at high effort using Carbon’s standard rates. At launch, however, Google was offering Carbon for $2 per million input tokens and $10 per million output tokens through November 30. Its standard rates were $4 and $20. The chart captures a particular price comparison, while the bill a customer paid depended on the rates in force.
Gemini 4 Neon in Google’s 19-row benchmark comparison
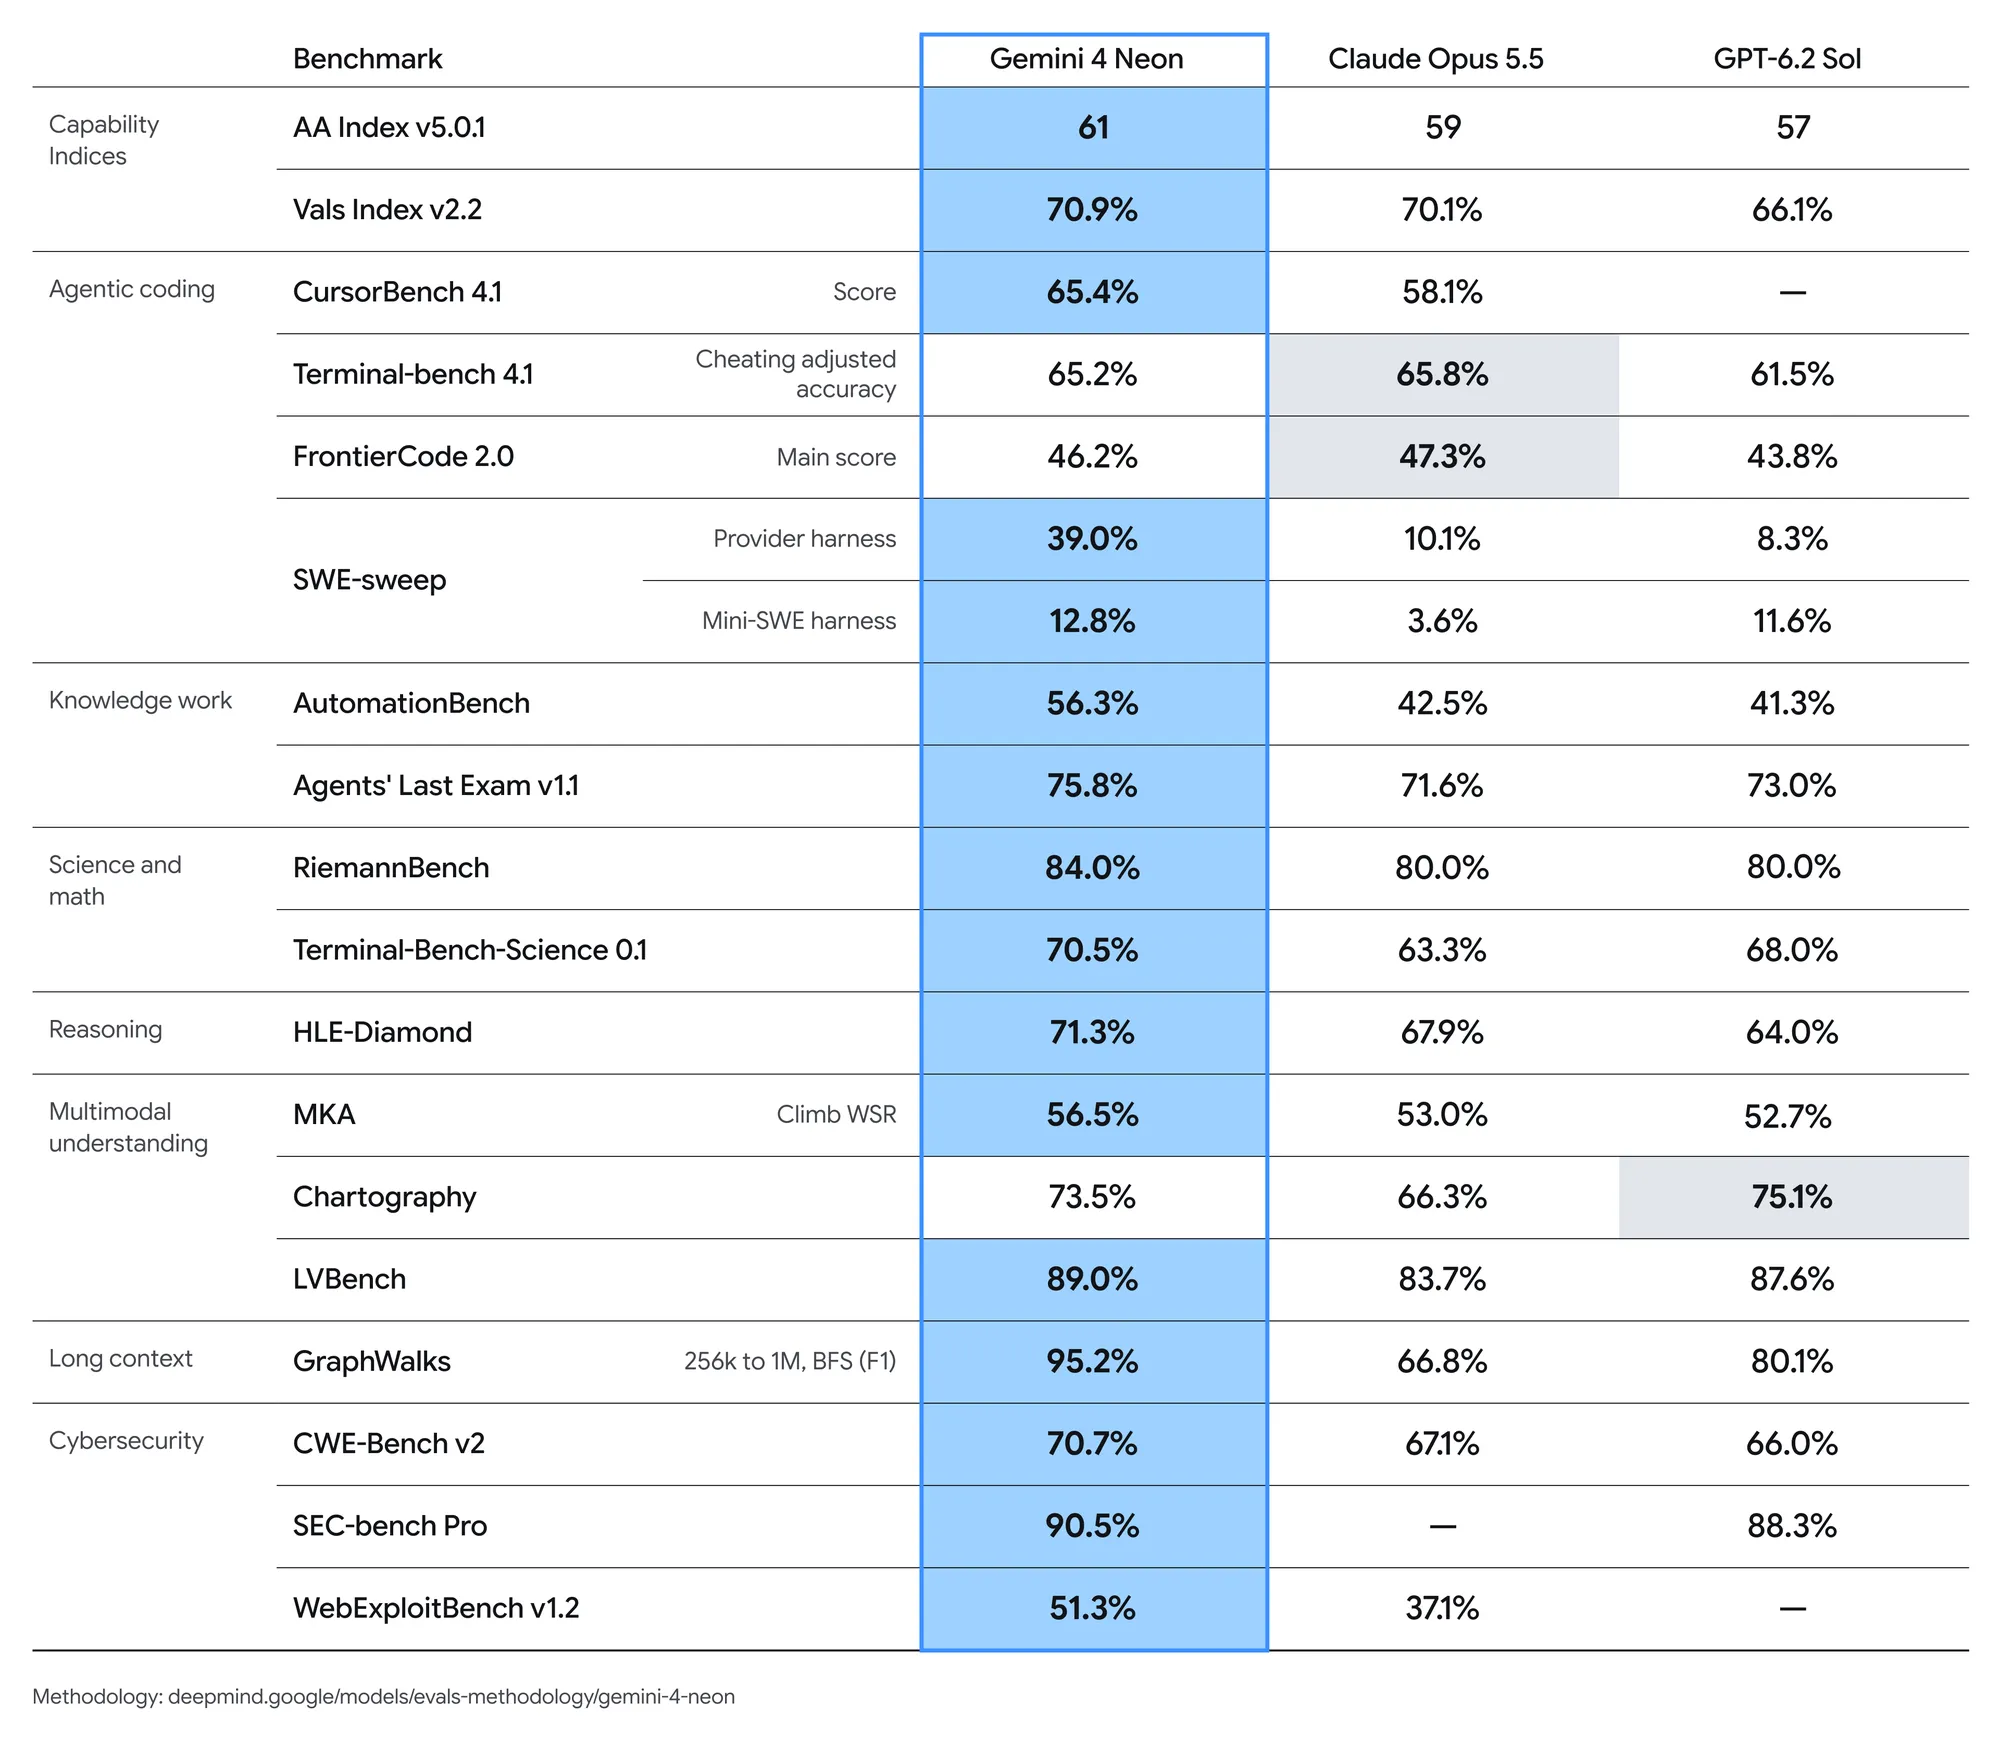
Google’s table brings together eight areas of testing. It mixes index points, percentages and scores from different test setups. Read across a row to compare models on one measure. The first two columns identify the type of work and the test used to score it.
| Area | Benchmark | Metric or setup | Gemini 4 Neon | Claude Opus 5.5 | GPT-6.2 Sol |
|---|---|---|---|---|---|
| Capability indices | AA Index v5.0.1 | Index points | 61 | 59 | 57 |
| Capability indices | Vals Index v2.2 | Index score | 70.9% | 70.1% | 66.1% |
| Agentic coding | CursorBench 4.1 | Score | 65.4% | 58.1% | — |
| Agentic coding | Terminal-Bench 4.1 | Cheating-adjusted accuracy | 65.2% | 65.8% | 61.5% |
| Agentic coding | FrontierCode 2.0 | Main score | 46.2% | 47.3% | 43.8% |
| Agentic coding | SWE-sweep | Provider harness | 39.0% | 10.1% | 8.3% |
| Agentic coding | SWE-sweep | Mini-SWE harness | 12.8% | 3.6% | 11.6% |
| Knowledge work | AutomationBench | Score | 56.3% | 42.5% | 41.3% |
| Knowledge work | Agents’ Last Exam v1.1 | Score | 75.8% | 71.6% | 73.0% |
| Science and math | RiemannBench | Score | 84.0% | 80.0% | 80.0% |
| Science and math | Terminal-Bench-Science 0.1 | Score | 70.5% | 63.3% | 68.0% |
| Reasoning | HLE-Diamond | Score | 71.3% | 67.9% | 64.0% |
| Multimodal understanding | MKA | Climb WSR | 56.5% | 53.0% | 52.7% |
| Multimodal understanding | Chartography | Score | 73.5% | 66.3% | 75.1% |
| Multimodal understanding | LVBench | Score | 89.0% | 83.7% | 87.6% |
| Long context | GraphWalks | 256K to 1M tokens, BFS (F1) | 95.2% | 66.8% | 80.1% |
| Cybersecurity | CWE-Bench v2 | Score | 70.7% | 67.1% | 66.0% |
| Cybersecurity | SEC-bench Pro | Score | 90.5% | — | 88.3% |
| Cybersecurity | WebExploitBench v1.2 | Score | 51.3% | 37.1% | — |
Source: Google launch benchmark table
Data as of: 2026-11-18
AA Index scores are in points. Other rows show percentages. A dash means Google supplied no value.
Where each model leads
Three rows show why the choice of task matters. Neon led the listed models on workplace automation at 56.3%. On Terminal-Bench 4.1, Opus finished ahead at 65.8% to Neon’s 65.2%. On Chartography, which tests how well models read charts, Sol led at 75.1% to Neon’s 73.5%. Google gives no Sol score for CursorBench or WebExploitBench, so those rows support only a two-model comparison.
How the test setup changes the result
The two SWE-sweep rows use the same coding benchmark. In one, DeepMind ran Neon in Antigravity, Opus in Claude Code and Sol in Codex. Neon scored 39.0%, compared with 10.1% for Opus and 8.3% for Sol. When the researchers used the Mini-SWE setup, Neon scored 12.8% and Sol scored 11.6%. The gap between them shrank from 30.7 percentage points to 1.2.
The video results have a different caveat. DeepMind ran LVBench without tools and sampled the video differently for each model because of limits in their interfaces. Gemini received one low-resolution frame per second. Sol received 500 frames and Opus received 600. A score from that row reflects the video input each system could use.
GraphWalks tested a narrower question about long inputs. DeepMind used 200 problems with between 256,000 and one million tokens of context. Neon scored 95.2% on the reported graph traversal measure. That is evidence about following connections in that test. It gives no accuracy rate for finding a disputed charge in a customer’s bill.
DeepMind generally tested Neon at its highest reasoning setting, with exceptions such as FrontierCode, which used high effort. For competing models it generally drew on providers’ published scores, with exceptions documented for individual tests. The launch table therefore combines results from several evaluators and methods.
DeepMind also says Neon can invent details. It lists March 2026 as the cutoff for the model’s built-in knowledge and says its information can be older in some fields. At launch, DeepMind said it would release a separate safety and security report in the coming days.
Sources: Google launch announcement, Google DeepMind model card, Vals AI index, Vals AI model profile, Google token guide, Google benchmark table, Google cost and score chart, DeepMind test methods, Artificial Analysis launch evaluation, Artificial Analysis effort comparison